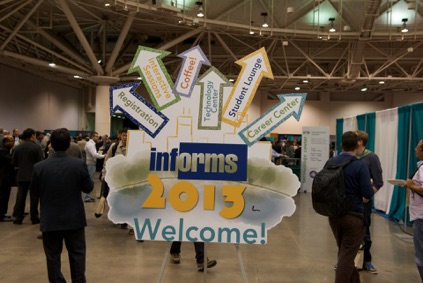
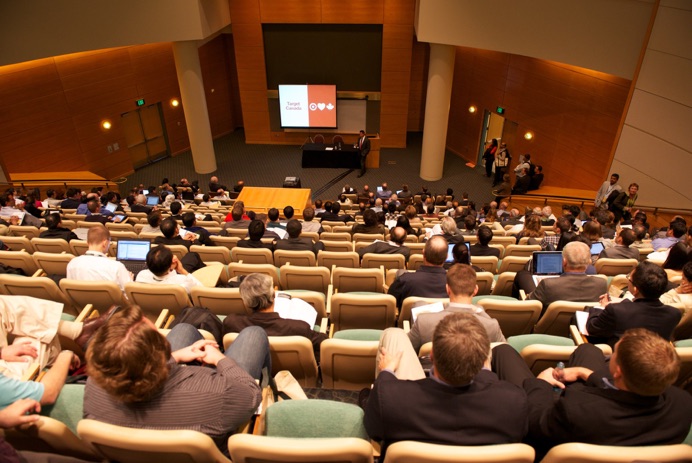
INFORMS 2013 Annual Meeting in Minneapolis, MN

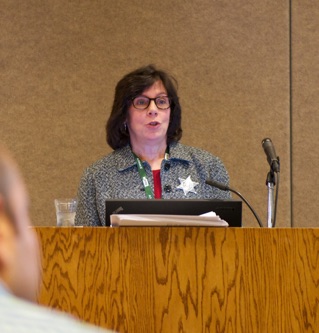
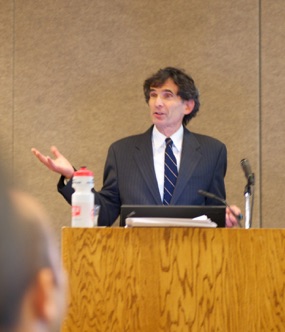
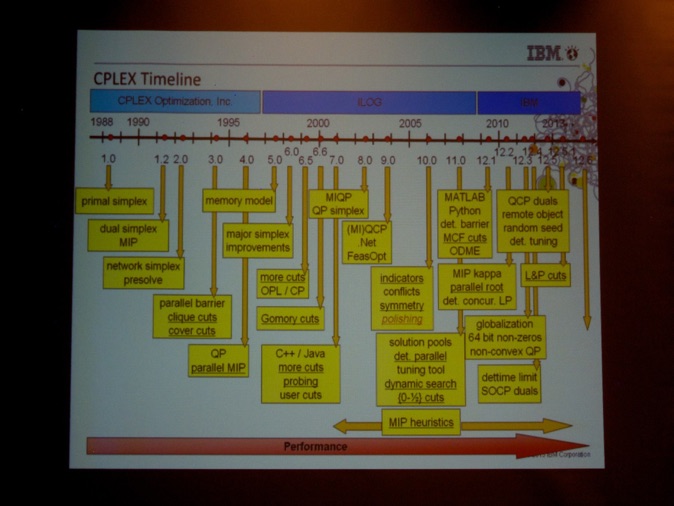
Oct. 6-9, 2013 the INFORMS 2013 Annual Meeting was held in the convention center of Minneapolis, MN. 4,300 attendees were registered. This event has turned into the premier worldwide gathering of analytics professionals as well as academics. The choices of specific sessions are of course highly personal, so yours truly (@dirkvandenpoel) does not claim representativeness for the entire event. So let’s now discuss the event in chronological order. The event started off with pre-conference vendor sessions. This year, I decided to pay IBM’s session a visit. It was titled: “Building a Smarter Planet with Decision Optimization”. First, the many IBM presenters (see pictures below) gave a technical talk mainly centered around the new CPLEX features (see the timeline picture below).
Wednesday 9 October 2013

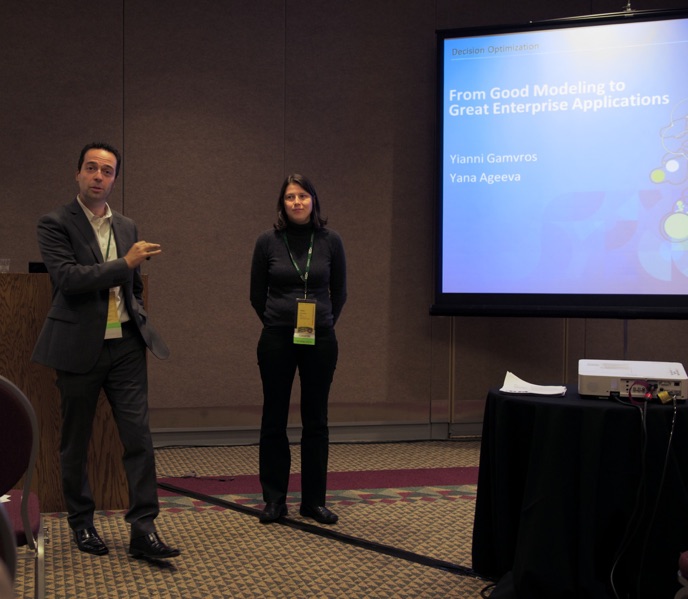
Second, Yana Ageeva and Yianni Gamvros (both IBM employees, see picture below) took the stage to translate the technical story into great applications. They gave many real-life examples of how OS/MS helps businesses take better decisions.
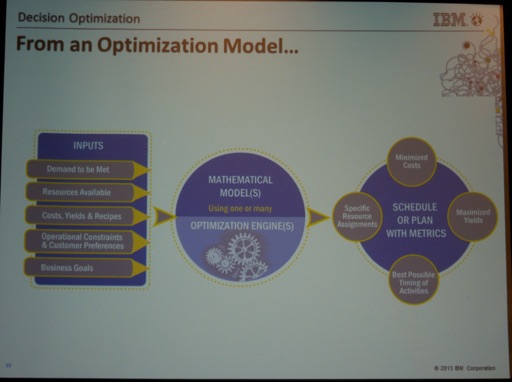
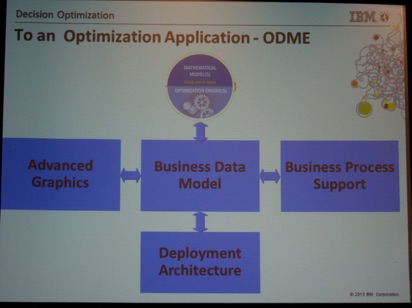
From an optimization model ... to an optimization application (see slides below).
Finally, they wrapped up the excellent talk by giving an overview of the IBM Academic Initiative.
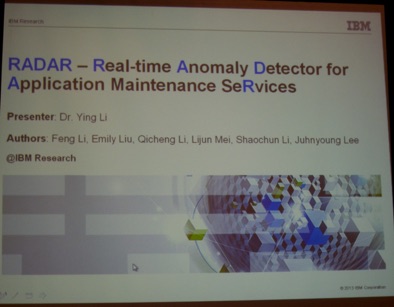
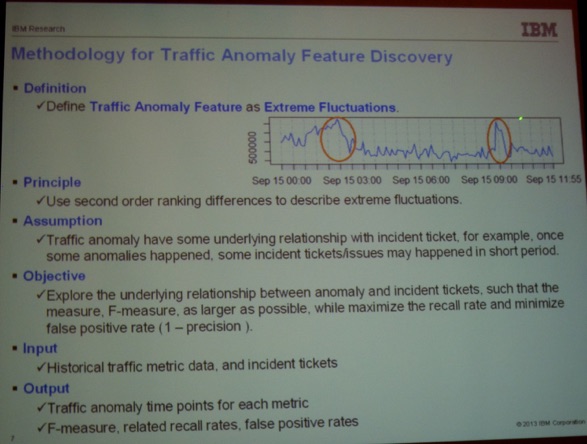
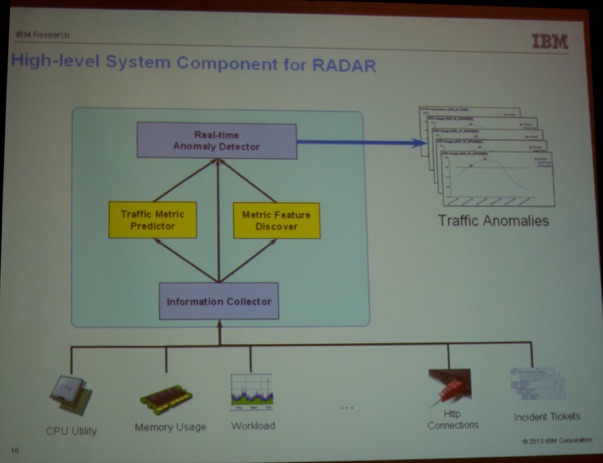
Sunday Oct. 6, 2013 was the first real day of the conference. I decided to first attend the “Gaining Business Insights from Big Data Analytics on Federated Data Sources” session. The first talk was titled RADAR - “Real-time Traffic Anomaly Detection for IT Incident Management” by IBM Research - China. They presented a system that uses association rule analysis for IT incident prediction to alert users about potential abnormal workload/traffic. They filed for a patent detailing this innovative methodology.
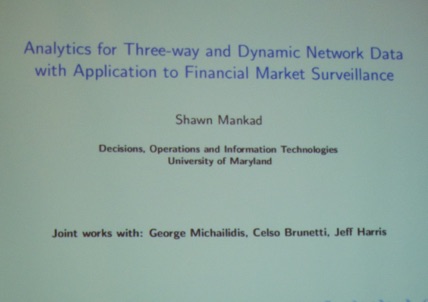
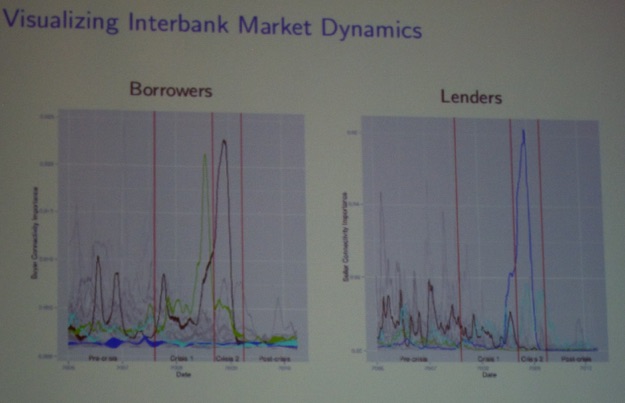
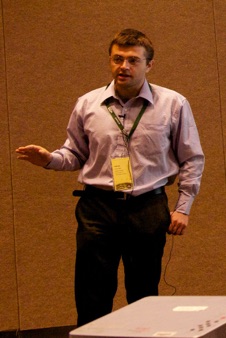
Next, Dr. Shawn Mankad (University of Michigan, see picture below) presented his paper titled “Analytics for Three-way and Dynamic Network Data with Application to Financial Market Surveillance”. He argues to compliment network statistics with new analytical tools that handle large network time-series by using Non-negative matrix factorization.
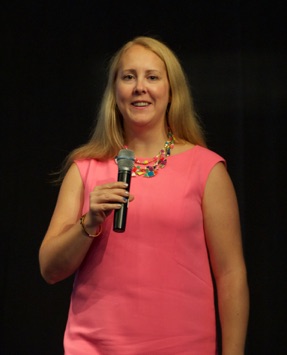
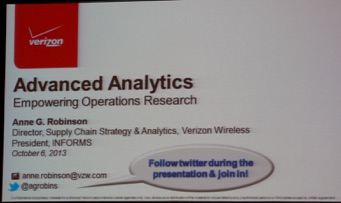
Next, I attended the first plenary presentation. Anne G. Robinson (@agrobins, President of INFORMS, see picture below) started by welcoming the thousands of analytics professionals and academics.
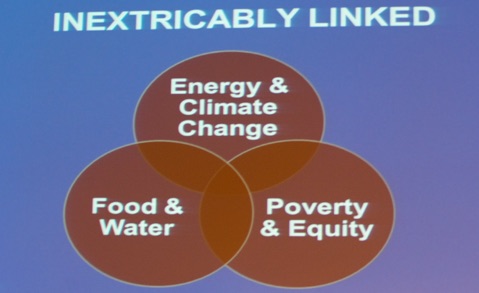
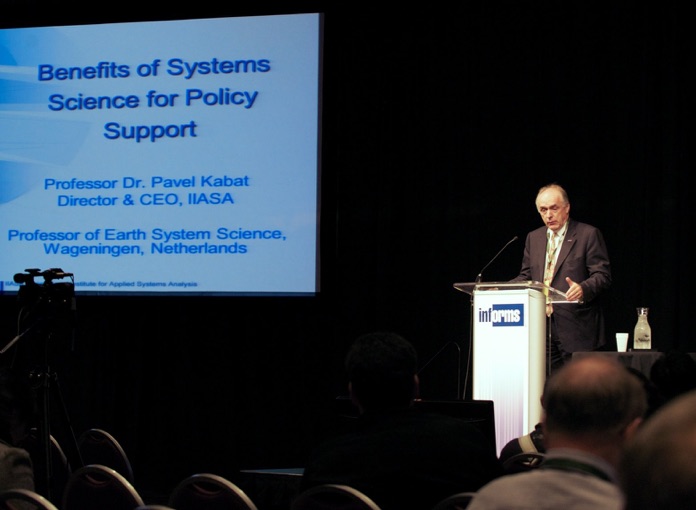
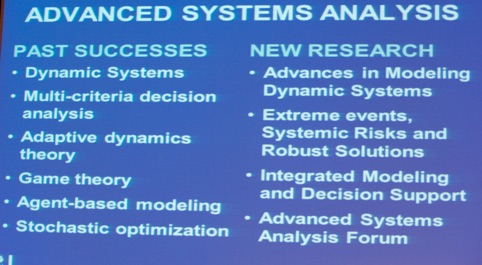
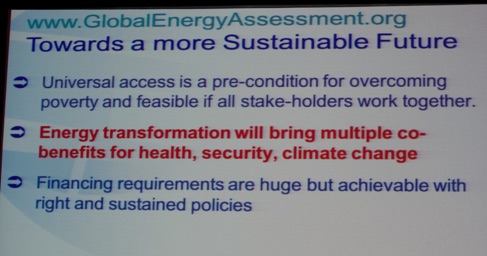
Then, the keynote presentation by Prof. Dr. Pavel Kabat (Director & CEO of IIASA, @IIASAVienna, see picture below) was held. The IIASA institute was founded in the 1970s as a bridge between East and West. Currently, it has 21 national member organizations with a research focus on the big issues: food, water, energy, climate change, poverty and equity. He argues that we need to invest about 1.7% of global GDP to solve the three biggest challenges the world is facing energy security, air pollution and health, and climate change.
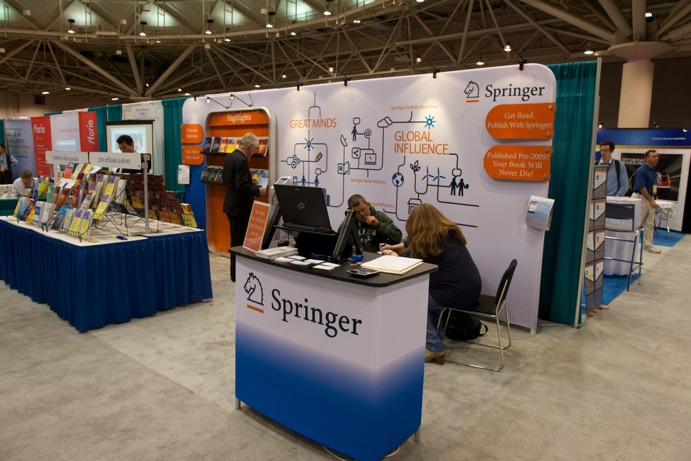
Moreover, there were booths of publishers.

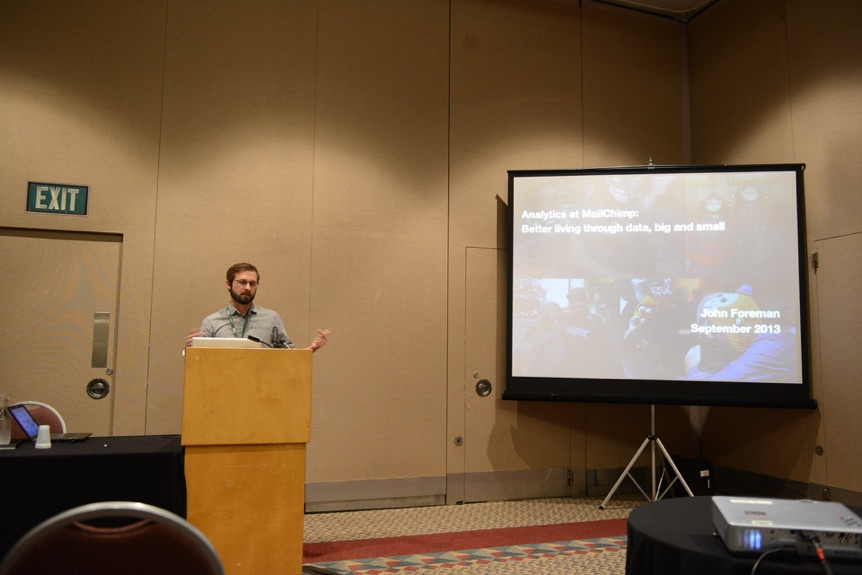
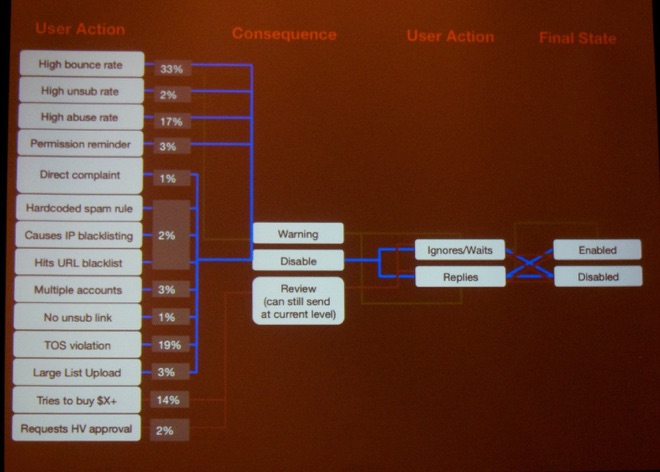
After lunch, I attended the “Big Data Analytics Case Studies in Pricing and Revenue Management” session. John Foreman (@John4man, Data Scientist at MailChimp.com, see picture below) gave his talk titled “Increasing Marketing Engagement using Graph-augmented A/B Testing at MailChimp.com”. They are the largest email service provider.
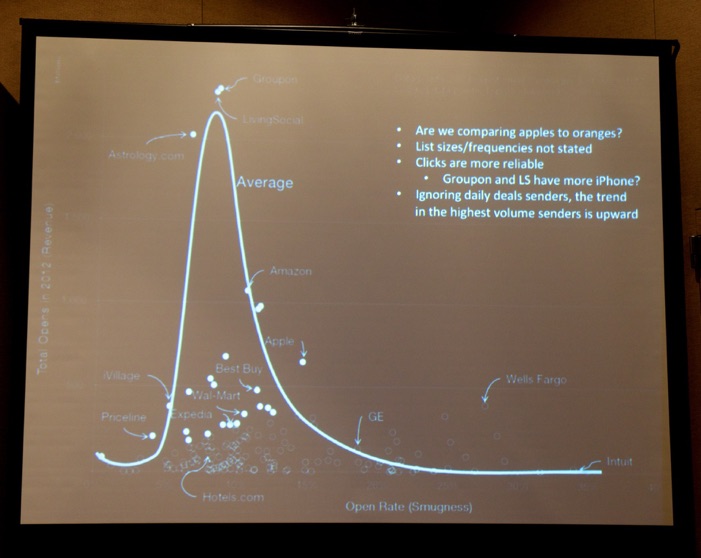
Having 4 million users, they are able to analyze a lot of email campaign. Below, you see a graph showing campaign outcomes of some well-known brands (open rate on the horizontal axis, total number of opens on the vertical axis). MailChimp owns many IP addresses which are used to send the emails from. Hence, they cannot afford getting blocked by spammers using MailChimp’s services. Therefore, they developed a predictive model to assess whether a given campaign may cause problems (see picture below). John Foreman is also the author of “Data Smart” published by Wiley.
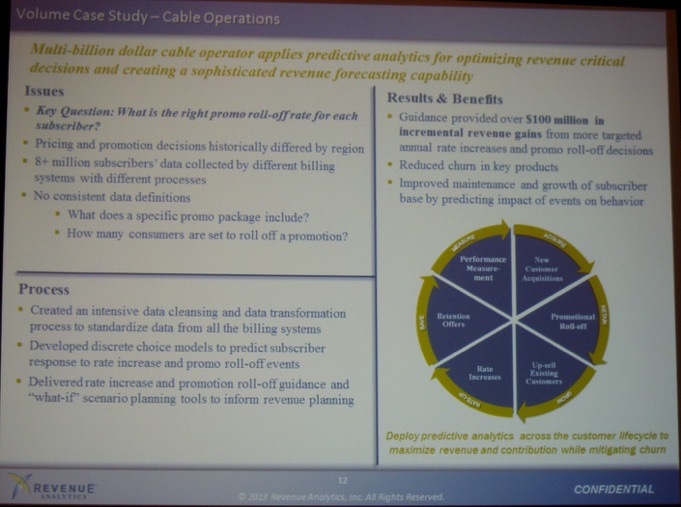
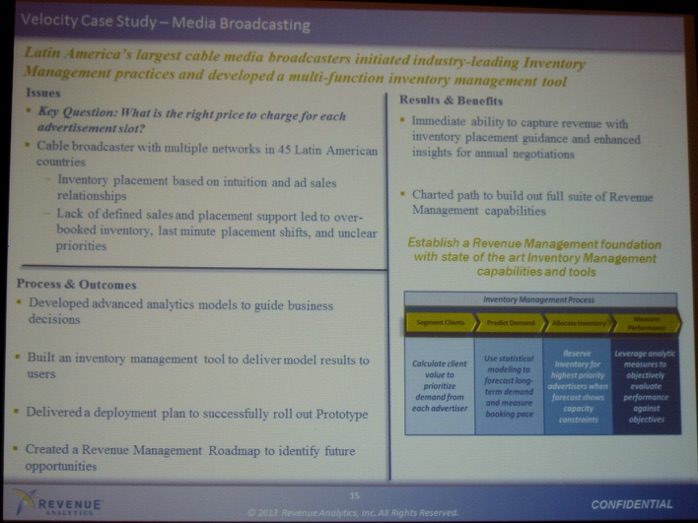
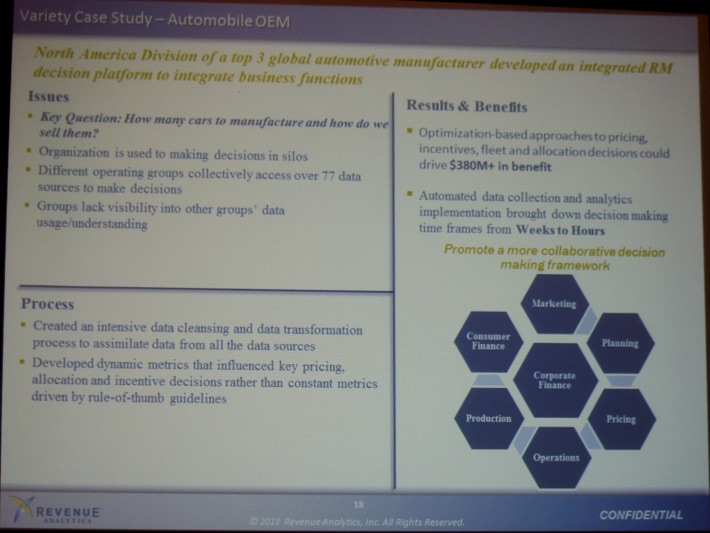
The other presentation in this session I particularly liked is the talk titled “Big Data Means Nothing without Big Data Analytics” by Anand Srinivasan (Consultant at Revenue Analytics, @Rev_Analytics) and Dr. Jon Higbie.
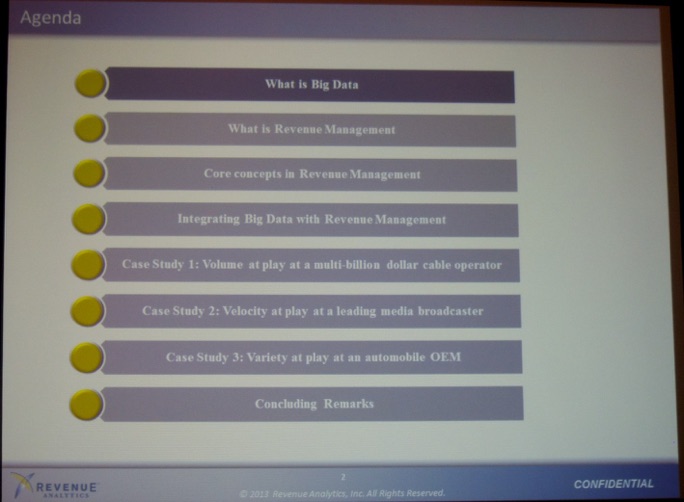
They provided three cases studies showing how big data made a difference in real-life projects in revenue management (see pictures below).
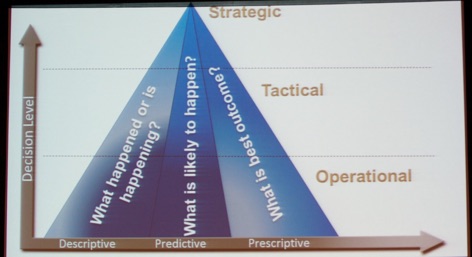
During the afternoon keynote, Anne G. Robinson (@agrobins, President of INFORMS, see picture below) took the stage again with a longer presentation about how advanced analytics are reshaping many businesses.
She also mentioned the increasing number of Analytics Master’s programs, but failed to mention that Ghent University was the first to offer such a program in 1999, the famous Master of Science in Marketing Analysis. This makes it the longest-running (predictive) analytics program in the world!
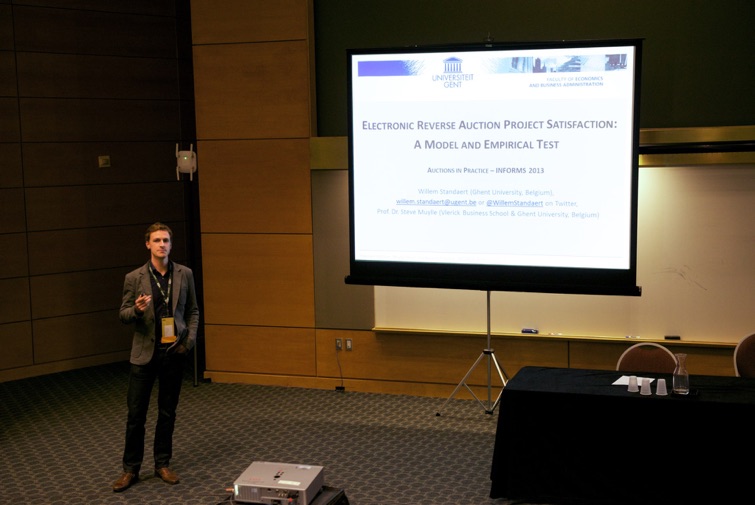
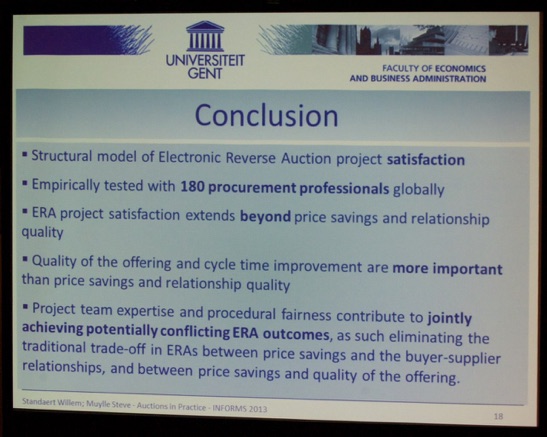
Next, I attended Willem Standaert (see picture below)’s session. He is a UGent PhD candidate, and he presented his paper “Electronic Reverse Auction Project Satisfaction: A Model and Empirical Test” (co-author: Prof. Dr. Steve Muylle).
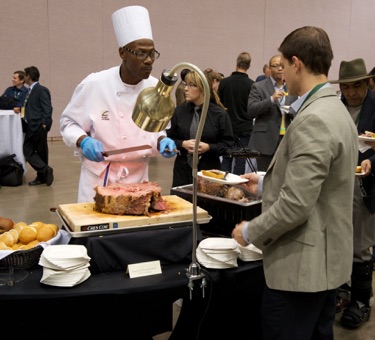
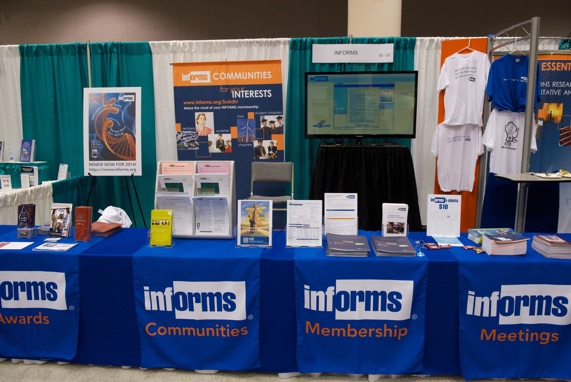
Then, the exhibit floor was opened and food was being served.

On Monday, I started by attending the Analytics Section Session. This was in fact part of the “Innovative Applications in Analytics Award”. Les Servi (@lds123, The MITRE Corporation, see picture below) “Analyzing Social Media Data Having Discontinuous Underlying Dynamics”. He started his talk by saying "Animals like to stay close to giraffes because they spot danger earlier, i.e., however imperfect your data, as long as there is a signal, it's useful."
He proposes and illustrates a new method to analyze mood shifts reflected in Twitter messages (he shows a POC related to one of the most popular soccer teams, Manchester United, during their 2011-12 season). Les is also coordinating the new Social Media Section at INFORMS. If you are interested to join, you can DM him on Twitter.
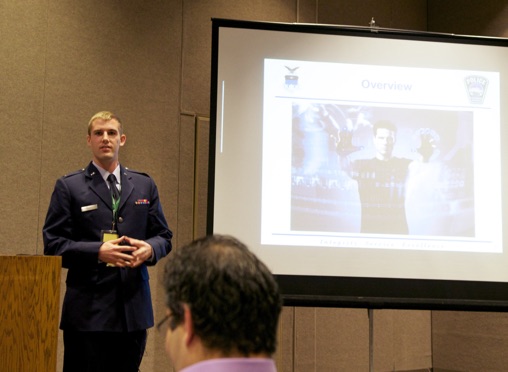
Next, Aaron Burns (United States Air Force Academy, see picture below) took the stage with a nice presentation titled “Development of Repeat Offender Model for Colorado Springs Police Department” (co-authors: Rebekah McKenna, Zachary Smith, Zebulon Hanley). He presented a repeat offender model that could help prioritize policing activities. This project created a model incorporating all types of individual offenses to determine the propensity to commit repeated crimes and prioritizes results with each crime’s weighted societal impact factor.
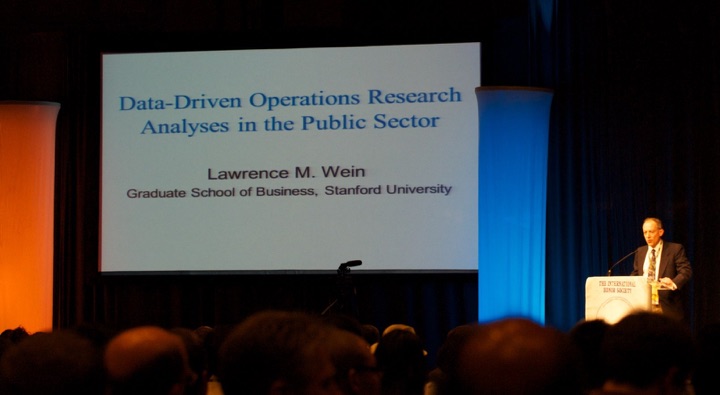
Prof. Dr. Lawrence M. Wein (Stanford University, see picture below) gave an OMEGA RHO distinguished lecture Monday. He discussed five applications of data-driven operations research analyses in the public sector. The first topic was about allocating blood for transfusions. The current policy for blood transfusions is FIFO (first in, first out) among exact matches. In a system that has (on average) more blood donations than transfusions required a LIFO (last in, first out) may make more sense since older blood may lead to medical complications. The predicted benefit of the policy is to reduce annual deaths by 20,000 in the U.S. Unfortunately, I had to leave this interesting keynote, because my own talk was in the next time slot.
fdsf
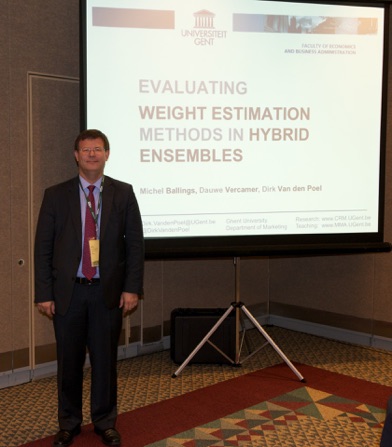
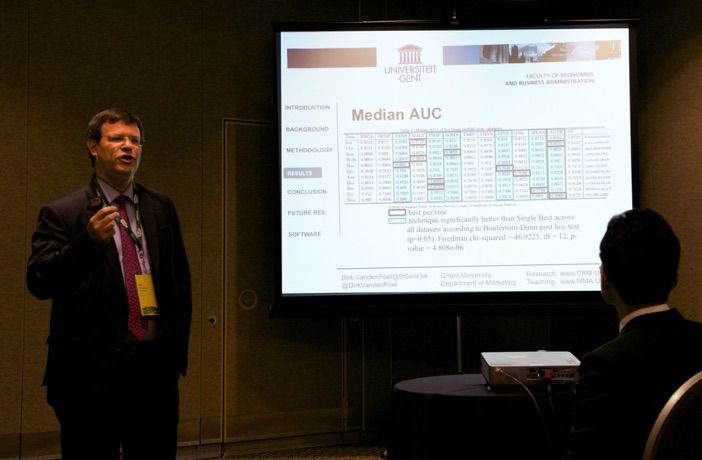
In “Theoretical Data Mining I” yours truly (@DirkVandenPoel, see picture below) presented joint work with Michel Ballings (@MichelBallings) and Dauwe Vercamer (@DauweVercamer) on hybrid ensembles. We evaluate multiple classifier fusion methods for a hybrid ensemble of the top-performing classifiers. We test 6 classifier fusion methods (Genetic Algorithm, Self-Organizing Migrating Algorithm, Memetic Algorithm with Local Search Chains, Differential Evolution Algorithm, Particle Swarm Optimization and Generalized Simulated Annealing) and 6 base classifiers (Support Vector Machines, Random Forest, Neural Networks, AdaBoost, Kernel Factory, and Logistic Regression) using AUC and 5x2CV.The presentation also included an explanation about a new open source R package hybridEnsemble (available for download at CRAN in the coming weeks), which implements the entire process discussed in the paper.
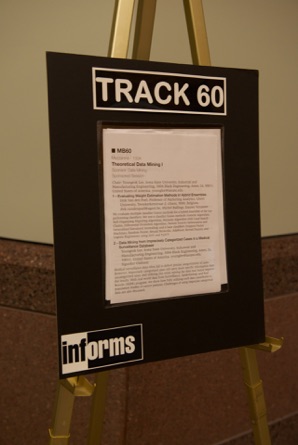
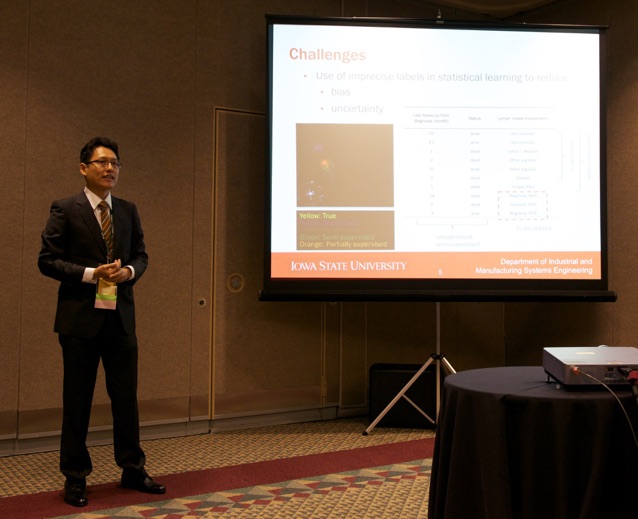
Next, Youngrok Lee (Iowa State University, see picture below) took the stage with his talk titled “Data Mining from Imprecisely Categorized Cases in a Medical Surveillance Database”. This paper centers around the idea that imprecisely categorized cases still carry more specific information than uncategorized ones, and utilizing this while mining the data may hence improve the results.
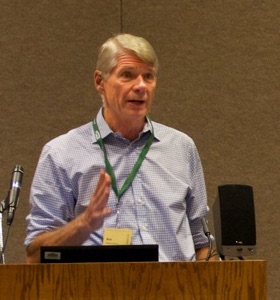
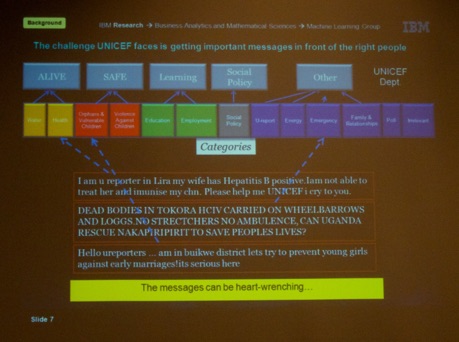
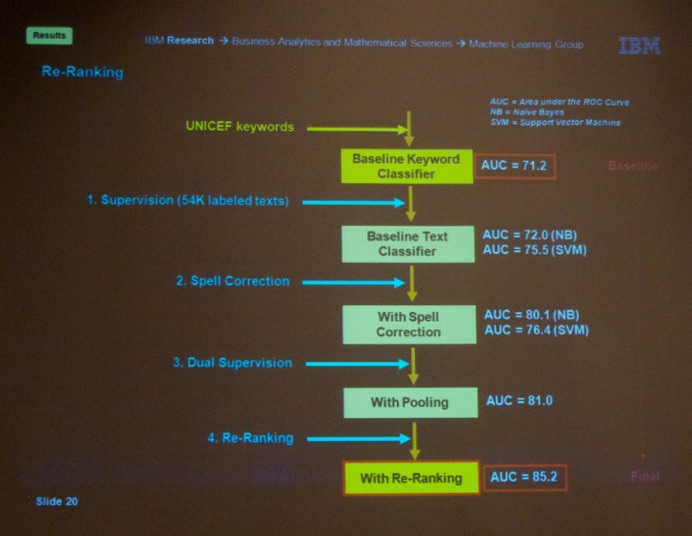
After lunch, I attended the “Innovative Applications in Analytics Award III” session. Prem Melville (IBM Research at Machine Learning Group) gave a great talk titled “A SMS Text Classification System for UNICEF Uganda” (co-authors: Rajesh Anandan,
Solomon Assefa, Vijil Chenthamarakshan, Rick Lawrence, James Powell, Sharad Sapra).
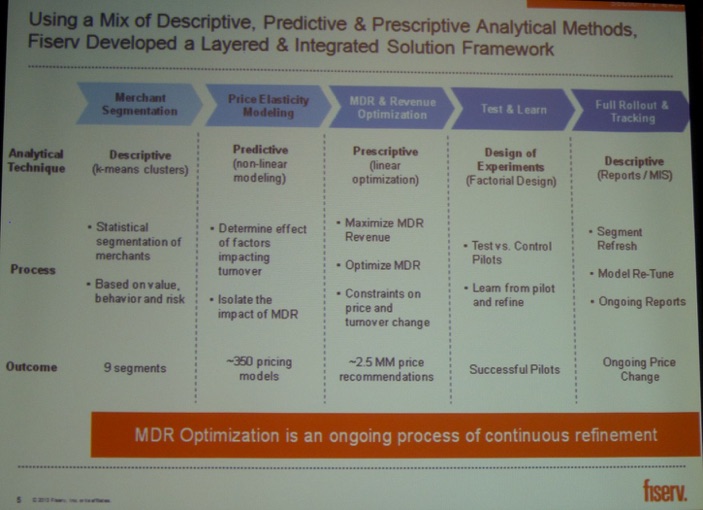
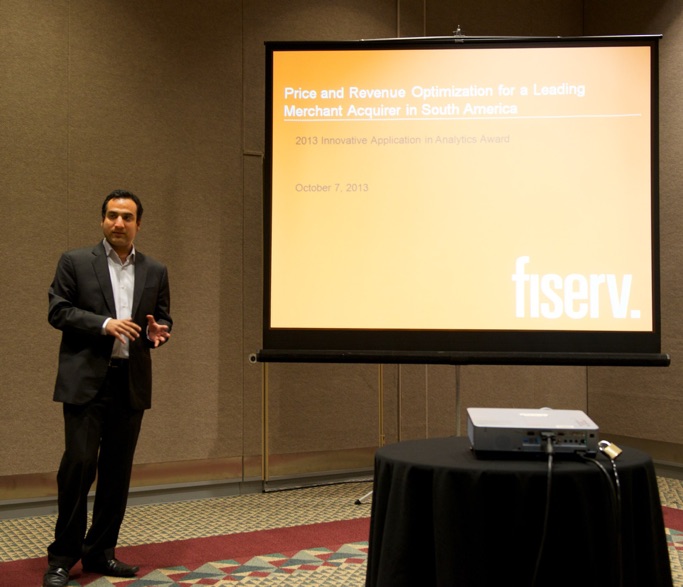
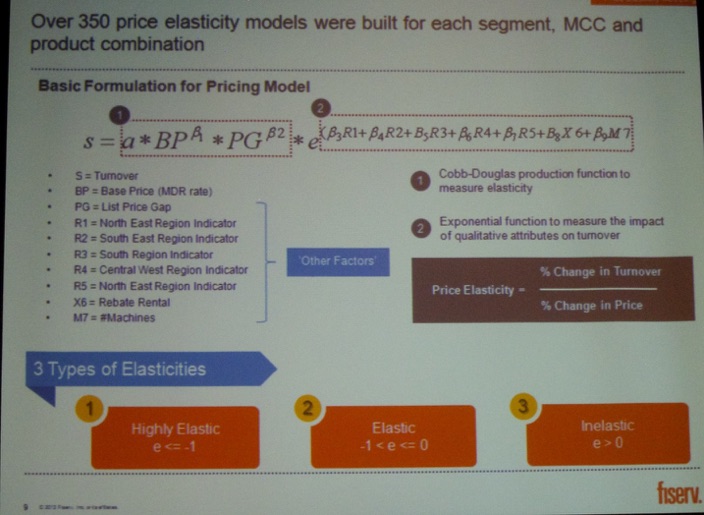
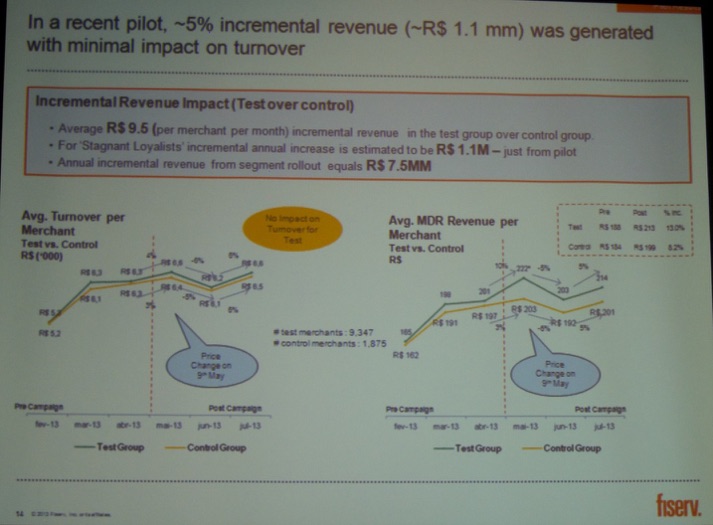
Another great presentation was by Suman Kumar Singh (Fiserv, see picture below) titled “Price & Revenue Optimization for One of the Largest Acquiring Banks in South America” (co-authors: Tarang Goyal, Aditya Khandekar). They carried out a segmentation study, and used these to estimate price elasticities per segment. I really appreciate the extent of detail they provided.
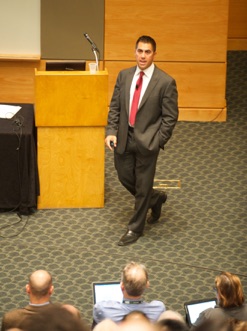
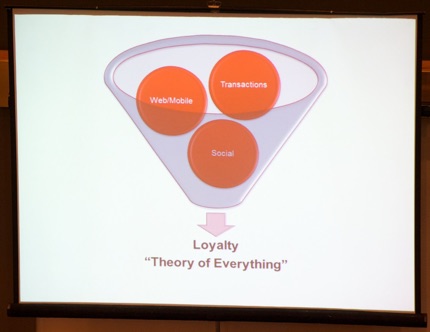
Next, I visited the keynote talk by Mark von Oven (Director of Merchandising Analytics, Reporting and R&D at Target Corp) titled “The Physics of the Target Guest”. Unfortunately, he did not disclose a lot of methodology used at Target.
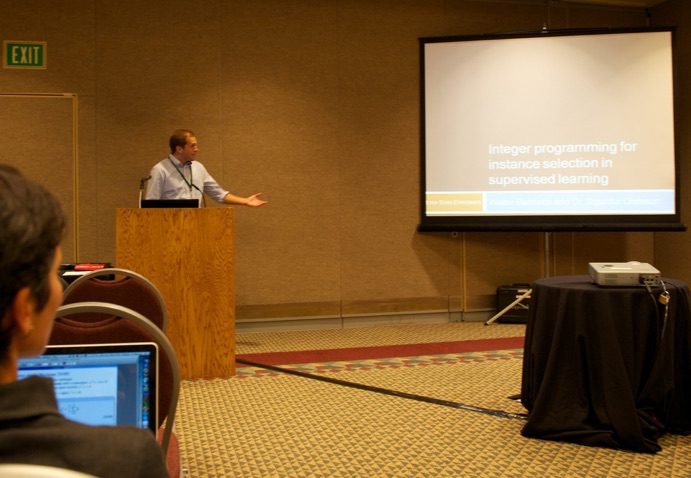
Next, I attended the ”Classifier Ensembles Generation Methods” of the Data Mining Section. Walter Bennette (Iowa State University, see picture below) presented his talk titled “Integer Programming for Instance Selection in Supervised Learning” (co-author: Sigurdur Olafsson). They use instance selection techniques that utilize integer programming to select a subset of the data in such a way that all or some classification learning algorithms will perform better when applied to the new and reduced training
dataset.
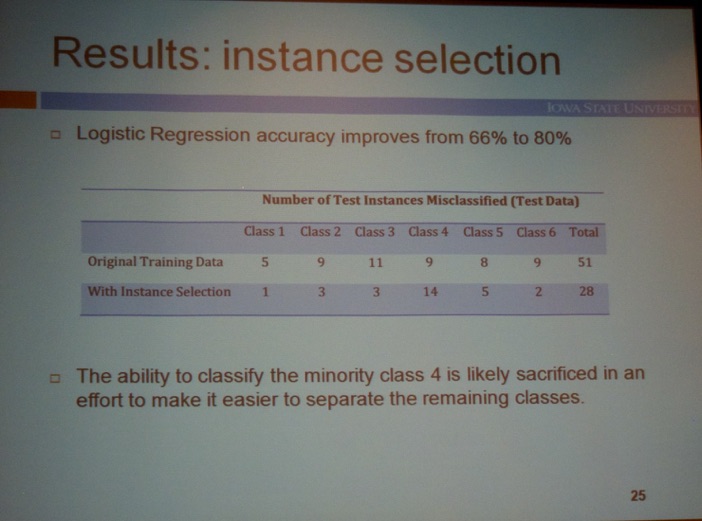
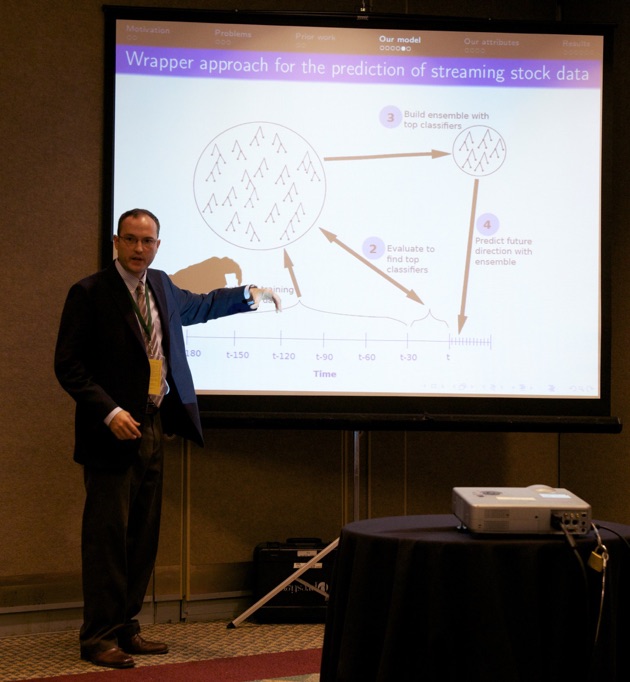
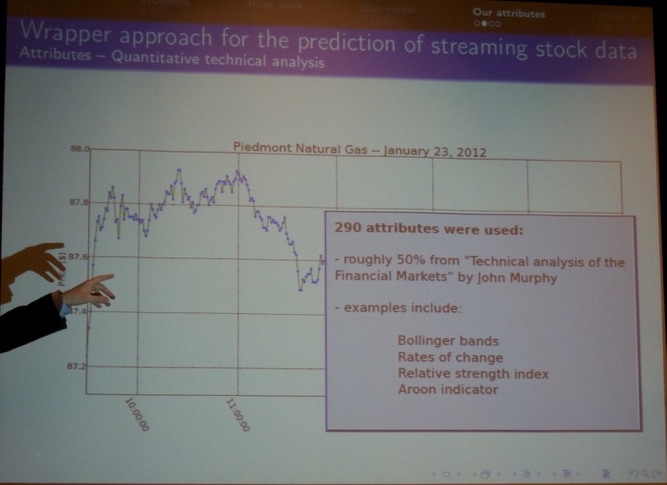
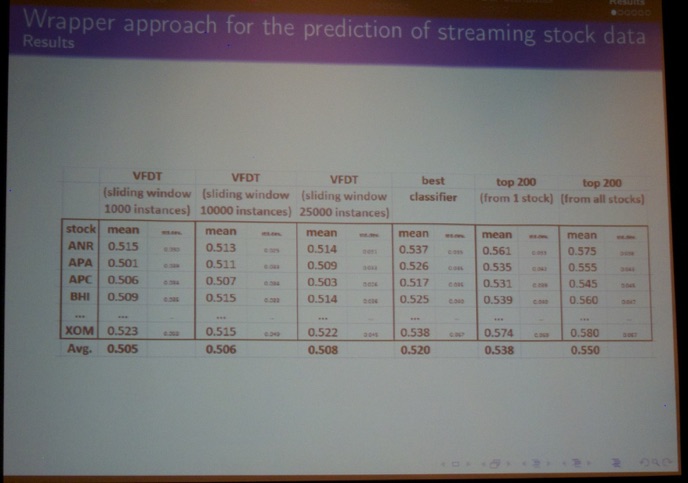
Next, Michael Rechenthin (University of Iowa, see picture below) presented his paper titled “A Machine-learning Technique for the Prediction of Equity Price Direction” (co-author: Nick Street). The authors use machine learning techniques to anticipate future directional price moves in stocks in the very short term. Historical price data and technical analysis indicators are used to build thousands of classifiers that are then employed in dynamically-constructed ensembles across different stocks.They presented interesting results (see table below).
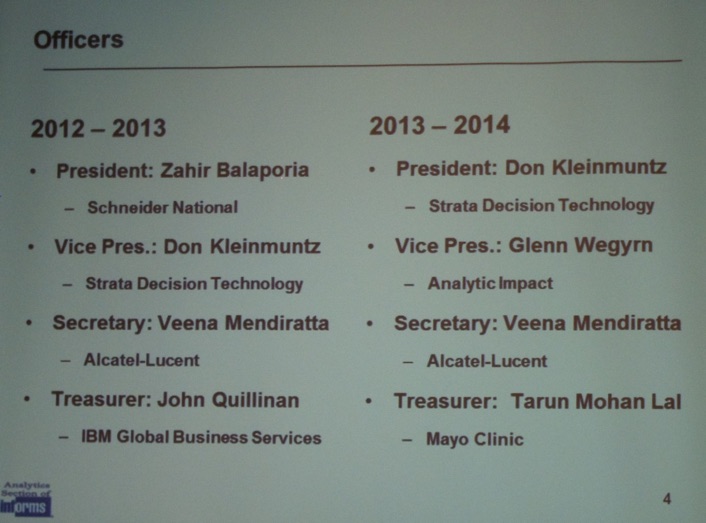
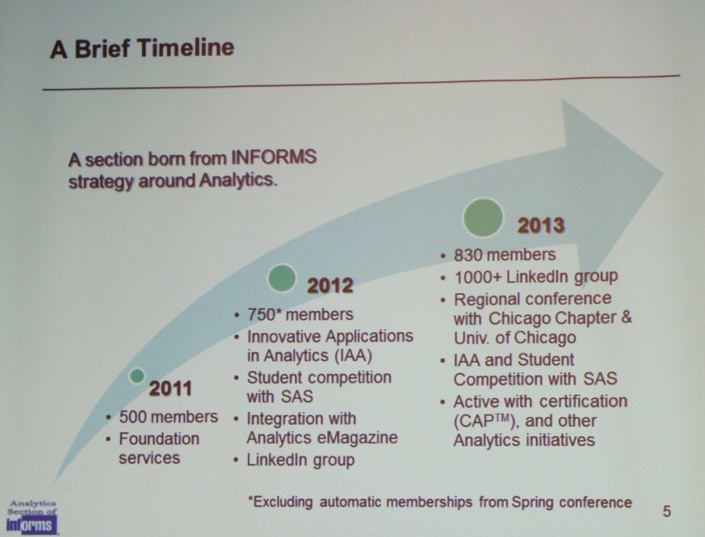
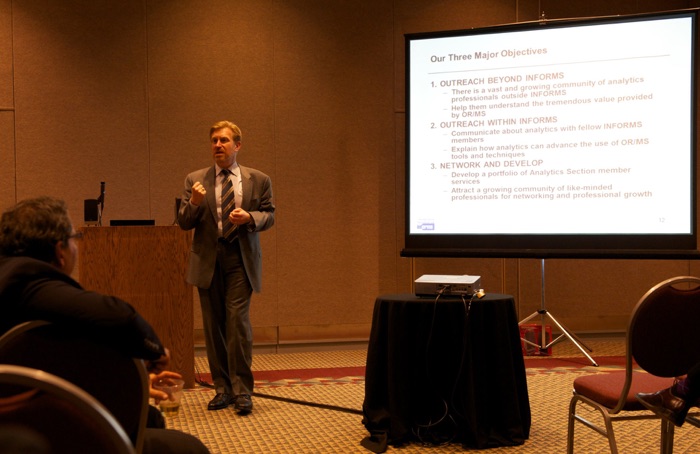
Then, I attended the Business meeting of the Analytics Section. Membership count is at 830 right now, which makes it the second-largest section of INFORMS. Then, the incoming president, Don Kleinmuntz (see picture below), talks about his objectives for the coming period.
On Tuesday, I started off in the “Recommendation” session with Nabita Penmetsa’s (University of Pittsburgh, see picture) talk titled “Targeting in Online Advertising Markets”. Internet platforms are collecting huge amount of data about customers, using various tracking technologies. This information can improve the effectiveness of online advertising and attract advertisers to the platform. However, consumer privacy concerns can limit the level of targeting that can be used by platforms. In the presence of this trade-off, we analyze the targeting and pricing decisions of competing platforms in a two-sided market model with heterogeneity on both sides of the platform.
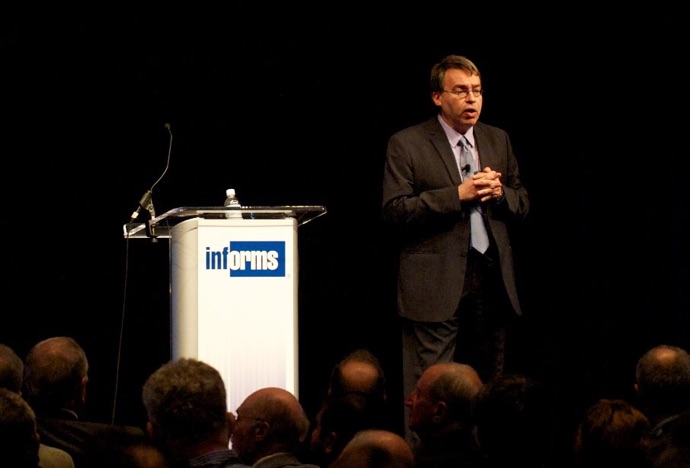
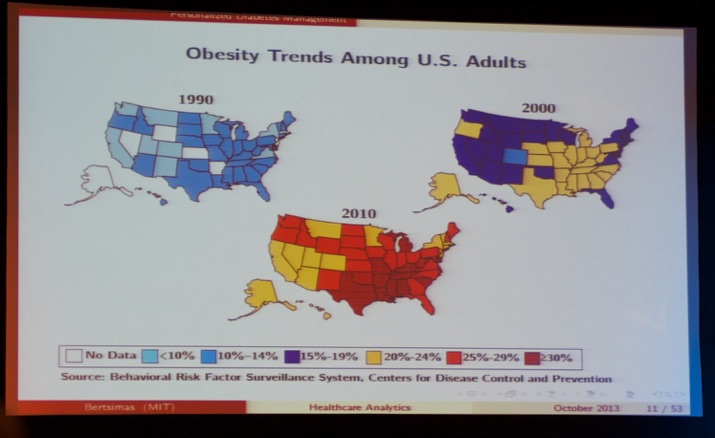
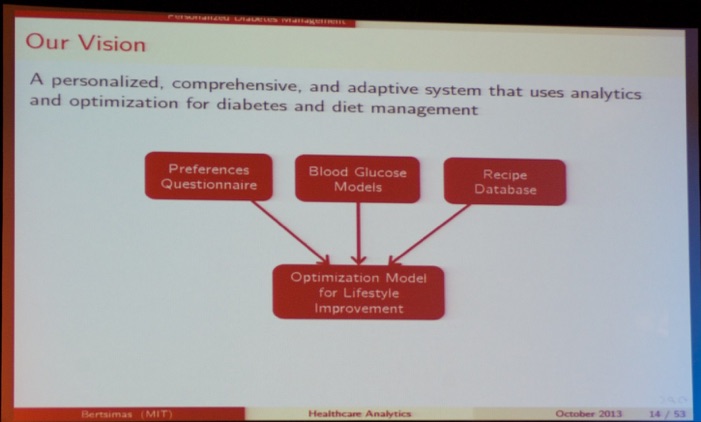
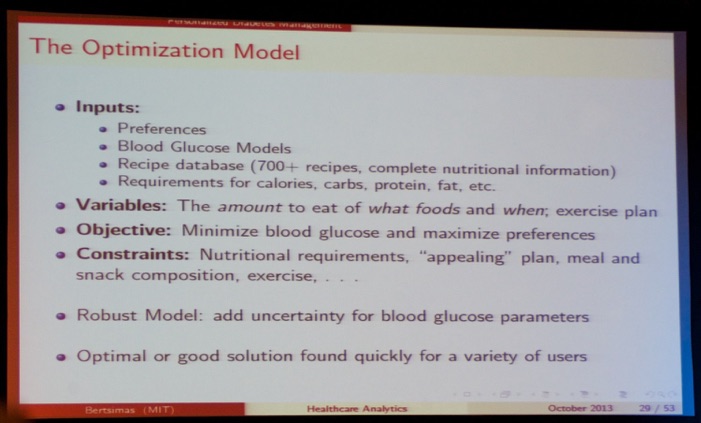
Next, I attended the keynote talk by Prof. Dr. Dimitris Bertsimas (MIT) titled “Healthcare Analytics”. He mainly talked about personalized medicine. More specifically, he gave an on-screen demo of Lifestyle Analytics (LiA), a web-based application that uses analytics to design food and exercise plans tailored to the user's preferences to control blood glucose - an ideal tool for persons at risk of diabetes.
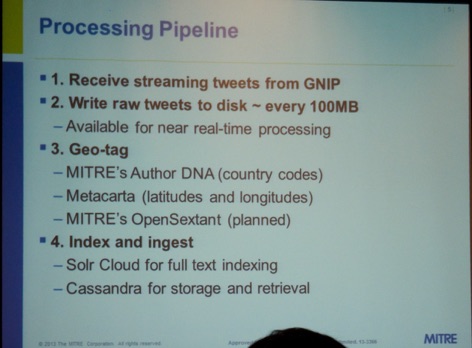
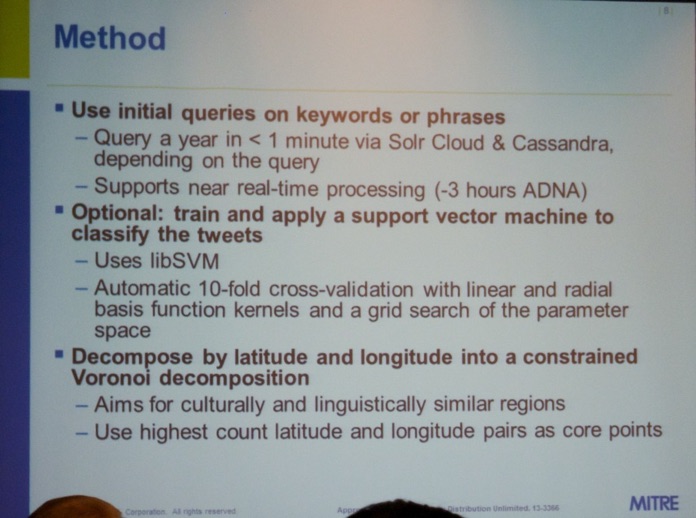
Next, I attended the “Understanding through Social Media” session. First, Jared Mowery (The MITRE Corporation, see picture below) took the stage with the talk titled “Automatic, Near Real-time Event Detection in Twitter” with a very informative presentation. This project aimed to explore the space of events that can be automatically detected in near real-time using Twitter data coupled with statistical analysis and machine learning techniques. They anticipate to semi-automate this process to enable rapid, cost-effective development of detectors in a variety of domains. He illustrated this project using Twitter messages on Earthquakes.
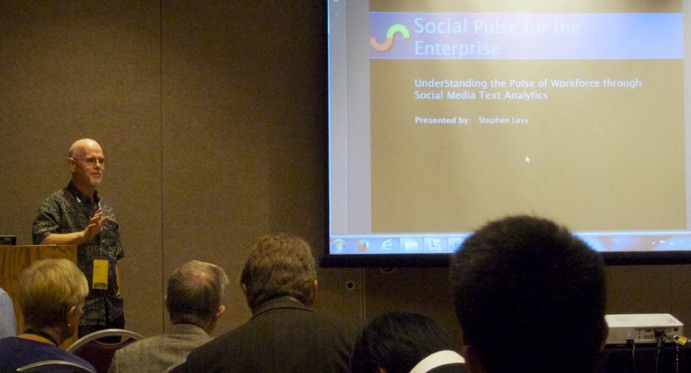
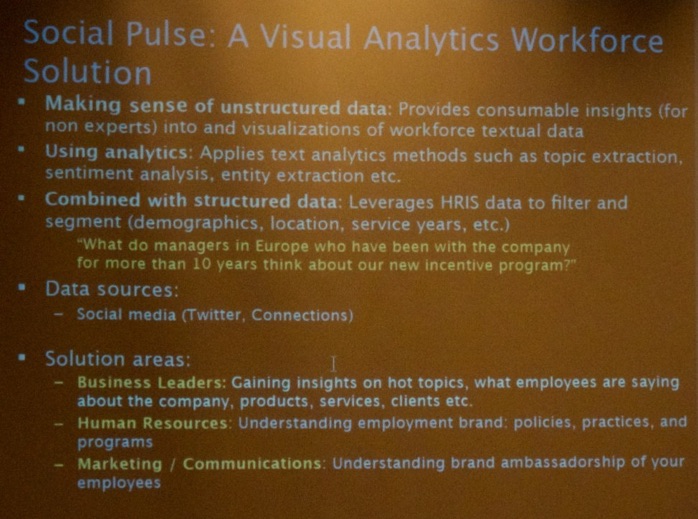
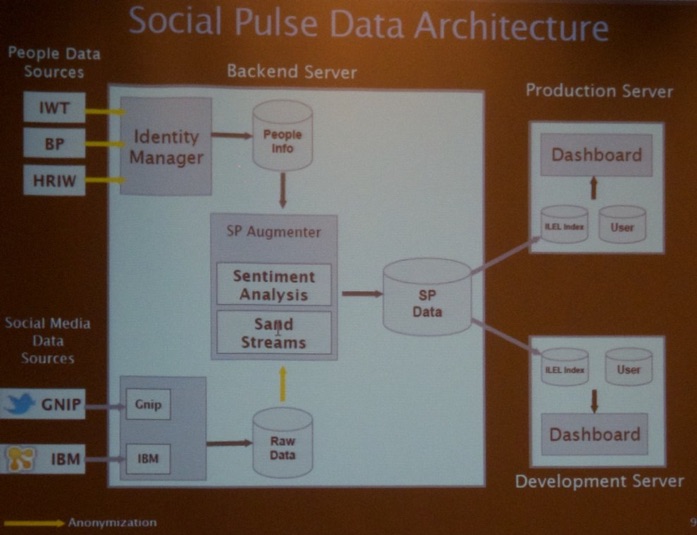
Next, Stephen Levy (IBM, see picture below) presented the talk “Understanding the Pulse of the Workforce through Social Media Text Analytics” (co-author: Wermer Geyer). The use of social media within the enterprise is increasing and with it the availability of unstructured text data containing the public “voice” of the IBM workforce. He presented an application that helps make sense of unstructured data by applying text analytics methods (topic extraction, sentiment analysis, etc.). Combined with structured data from corporate directories, they can effectively filter and segment social data based on demographics to provide targeted insights into the workforce.
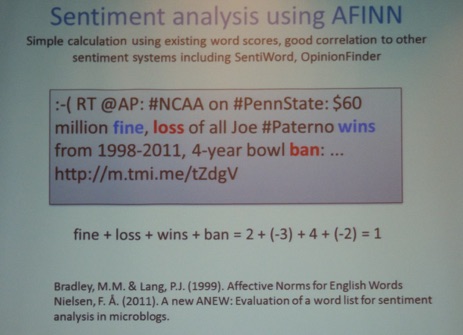
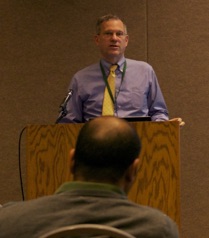
Next, Andrew Todd (University of Virginia, see picture below) presented his talk titled “The Paterno Riots: What Can Twitter Tell Us?”. Social networking sites are a source of public opinion on a wide range of topics from consumer products to politics. He examined Twitter content up to and during the firing of Joe Paterno and subsequent riots. He applied existing methods of sentiment analysis and suggests how metadata and information from the structure of social networks can be used to construct and enhance sentiment indicators.
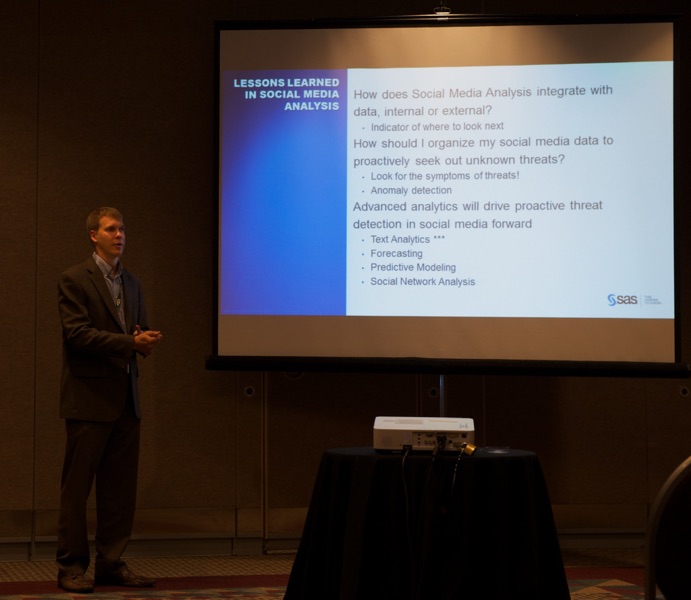
After lunch, I again joined the Social Media Section for a talk by Tom Sabo (Sr. Solutions Architect at SAS, see picture below) titled “Social Media Intelligence for Regional Instability”. He analyzed social media messages with regard to the Arab Spring. More specifically, he presented visually and geospatially how indications of discontentment and stressor events in a region correlate with protest and instability. Such trend analysis can preempt the resurgence of militant groups and subsequent terrorist activity.
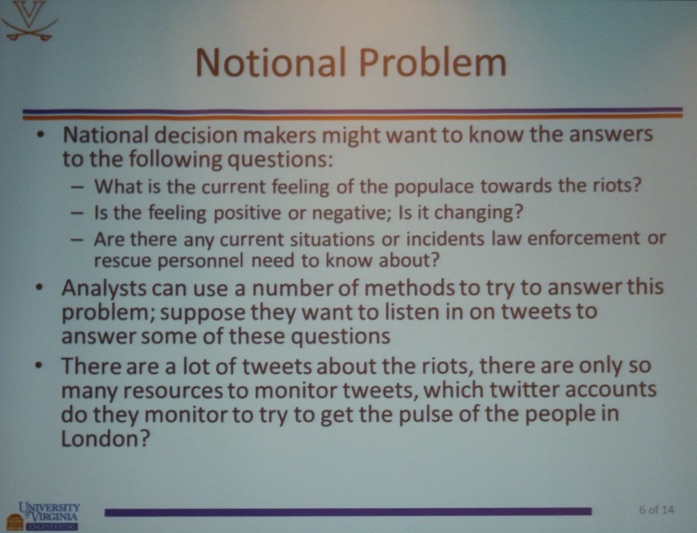
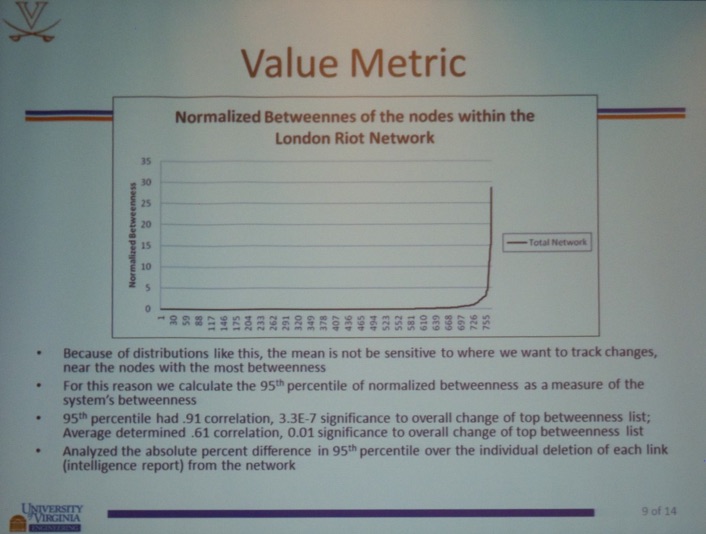
Next, Les Servi (The MITRE Corporation, see picture) presented his talk titled “Value of Information Applied to Networks” (Co-authors: Christopher Smith, Andrew Todd, William Scherer, Stephen Carr). A methodology is proposed to compliment the subjective “value” of intelligence with an objective metric of “impact” of information on network models. It would measure the impact of a piece of information on a network’s metric, in this case being used to answer intelligence analyst questions. In this paper, he explores data of tweets and applies the methodology to the links between twitter users to determine their quantitative impact on the overall network.
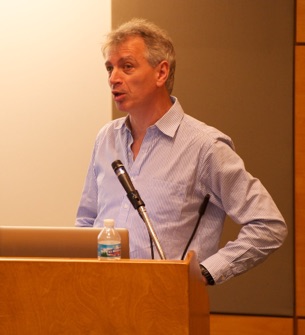
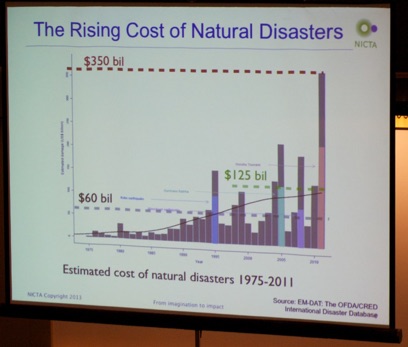
The afternoon keynote doubled as the IFORS Distinguished Lecture. Prof. Dr. Pascal Van Hentenryck (Optimization Research Group Leader at National ICT Australia & University of Melbourne, see picture below) gave a great talk titled “Computational Disaster Management: The Role of OR/MS”. He started his talk with the impact of natural disasters (see picture below). He gave several examples how OR/MS tools are important for preparation and response to disasters.
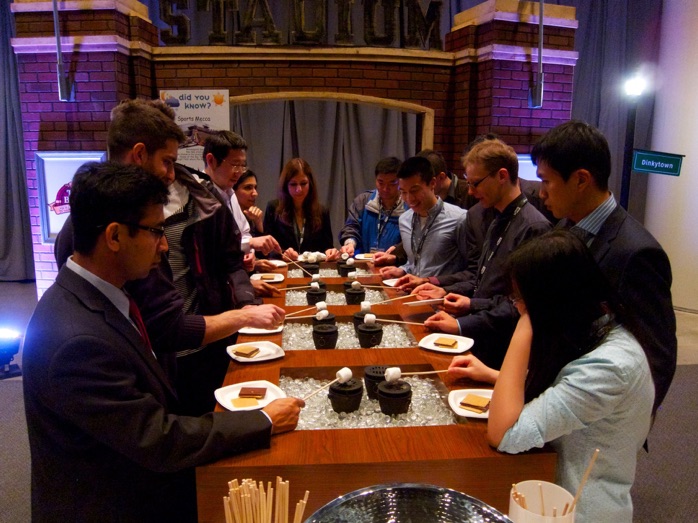
That evening the conference dinner was held. It wasn’t just food. The organizers had some other activities planned for the thousands of attendees... (see pictures below)

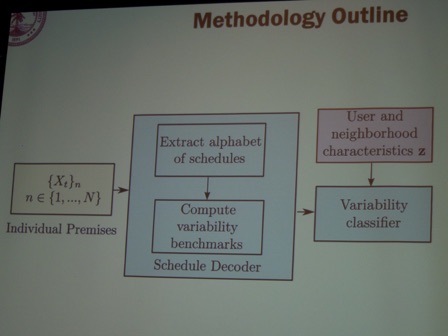
On Wednesday, Adrian Albert (Stanford University, see picture below) opened the Analytics session with his interesting talk “Energy Program Targeting: Data and Actions”. He presented methodology for profiling customers’ usage from large amounts of high-resolution sensor (“smart meter”) data.
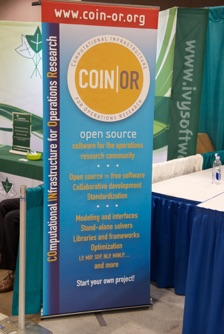
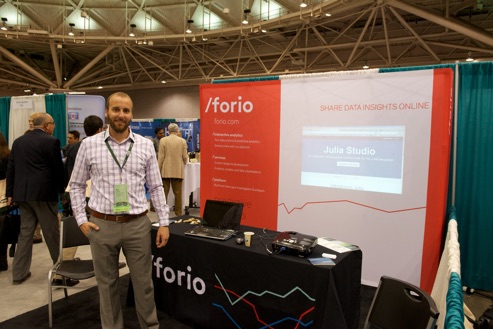
During the conference, I also walked the exhibit floor. See some impressions below. Open source always has a special place in our heart, therefore, we were very pleased to see COIN/OR (an open source optimization suite) as well as Julia (forio) again.
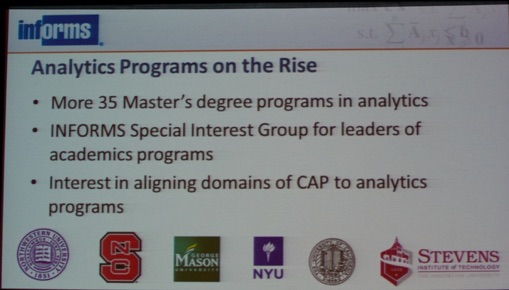
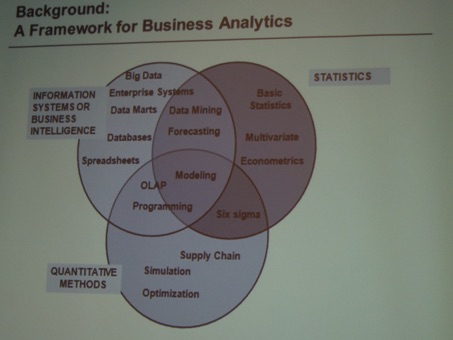
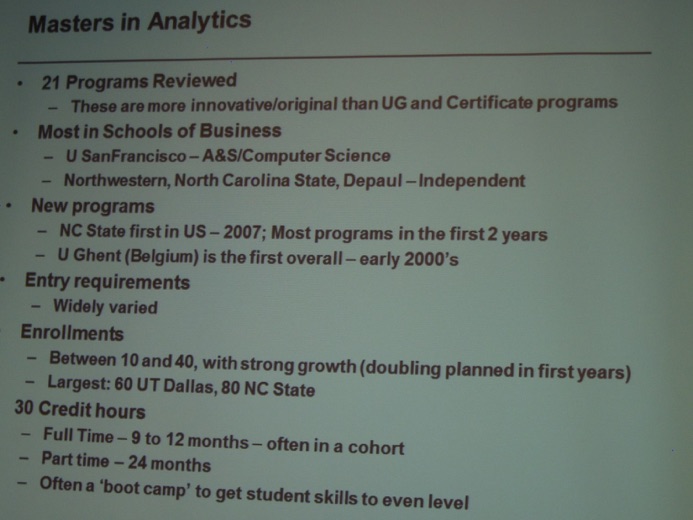
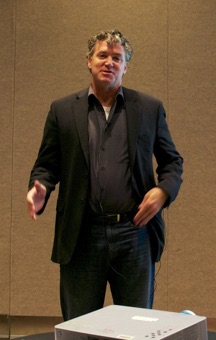
Next up was Prof. Dr. Mike Gorman (University of Dayton, see picture below), the first chairman of the Analytics Section of INFORMS, with his paper titled “Academic Response to the Analytics Wave: Taking Stock in Analytics Programs”. He (together with his co-author Ronald Klimberg) collected information on 40 different programs with an “Analytics” focus and report on the offerings. In some sense, without defining it, analytics can be characterized inductively by the topics covered in such offerings. Thanks Mike for rightfully acknowledging the Master of Science in Marketing Analysis (www.mma.UGent.be) at Ghent University as the first Analytics program in the world (it started in 1999).
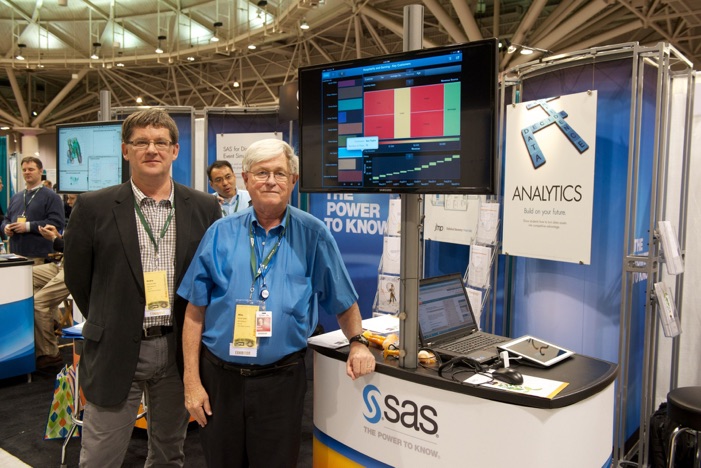
At a conference, one also sees a lot of good friends (e.g. Dr. Andre de Waal and Dr. Mike Speed, both at SAS, see picture below) again. Moreover, it’s always so nice to get to know new people.
It was also nice to see familiar faces of the INFORMS organization again, such as Terry Cryan (Director of Meetings at Institute for Operations Research & Management Sciences), and Gary Bennett (Director of Marketing and Member Services at INFORMS). Congratulations to all involved in making this an excellent event! See you next year in San Francisco for the INFORMS 2014 Annual Meeting.